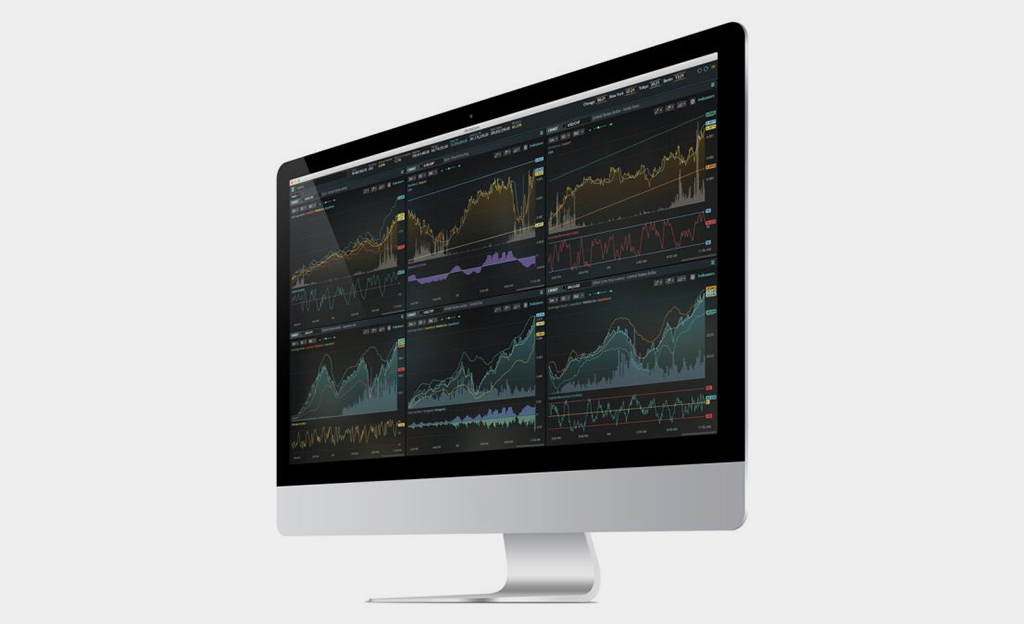
We are happy to introduce new features and improvements to our Charting Aggregations Service.
Track portfolio’s behaviour using formulas
Now you can track your portfolio’s behaviour by requesting aggregation data for a symbol that is expressed by a formula. Example: =AAPL+2*GOOG+3*NFLX.
Our Charting Aggregations Service charged with formulas is a ready-to-use tool for creating a virtual portfolio and analyzing its performance on the chart. Formulas are efficient for portfolio analysis and backtesting.
- Works for all available dxFeed data feeds
- Works for real-time and historical data
Intra-day candles are updated with new data
Implied volatility and open interest fields are now available not only in daily time-based candles but also in intra-day candles starting with 1-minute aggregations.
Intra-day candles with 1-minute aggregations are your fast lanes to IV and OI data. They contain more detail, and you can use them for intra-day data analysis. If you previously used our tickdata service to retrieve IV and OI, now you can request them using Charting Aggregations Service, especially if you need both historical data and real-time updates.
Candles representing regular trading session only
We have expanded our data offering even more: you can now exclude pre-market and post-market sessions from candle period and request time-based candles that aggregate valid ticks happened only during regular trading hours.
New candle types
Option expiration candles. This type of option specific aggregation helps to analyze the option price trends which can be noticed when one option is rolling to another.
Price Momentum candles. These candles allow to seeing the smoothed price movements and identifying trends, enabling micro market analysis.
Improved performance
We decreased response time, increased throughput, and now can manage up to 10+ million requests per minute through RMI.