Overview
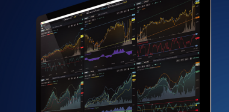
![Market Data Charting Aggregations Terminal]() Aggregated data services bring the next level of data visualization and analytics. They allow brokers, financial analysis software vendors, and wealth management firms to provide their clients with data services for multiple asset classes using various delivery options. Our services are beneficial for backtesting trading strategies, locating better trading opportunities, or simply delving into the market dynamics using our real-time, delayed, and historical data feed services along with market data aggregations.
Aggregated data services bring the next level of data visualization and analytics. They allow brokers, financial analysis software vendors, and wealth management firms to provide their clients with data services for multiple asset classes using various delivery options. Our services are beneficial for backtesting trading strategies, locating better trading opportunities, or simply delving into the market dynamics using our real-time, delayed, and historical data feed services along with market data aggregations.
Real-time data feeds
Provide better analytics and smarter trading opportunities with valuable data on the current market dynamics from a low-latency stream with candles created on-the-fly. The dynamics are also backed by historical data, reflecting the entire picture of the market situation.
Historical data downloads
Provide backtesting of trading strategies and historical data collection for analytics with our REST API dedicated to provisions of long time-series of historical candlestick data.
Multiple types of candles
We provide numerous types of aggregations:
- Tick-based
Every candle is based on any predefined number of ticks. Traders use them to define possible price movements based on earlier patterns.
- Time-based
Every candle is based on a predefined time interval: any number of seconds, minutes, days, weeks, months, or years. They help traders to see the market’s volatility.
- Volume-based
Every candle has a predefined volume. They help to identify more precise patterns in the price movement.
- Price-based
New candles are accumulated based on individual ticks and built only after the defined price movement happens. They help users to smooth the insignificant price changes and identify the trend more clearly.
- Price Momentum
These candles take into account not only price change but also the possible tick size of the instrument. They are more comprehensive and closer to the possible price movements on the market.
- Renko
A Renko candle is formed only if the closing prices on the chosen chart time frame moves at the pre-defined value (box size). It is designed to filter out minor price movements to make it easier for traders to focus on important trends.
- Price level
The pre-defined aggregate is split into the defined price slices. Such data presentation helps to see on which price level the maximum liquidity was accumulated inside the fixed time interval.
- Option expiration
Analysis of the option price trends can be noticed when one option is rolling to the other.
Learn more
Portfolio’s behavior tracking with formulas
Provide your clients with tracking of their portfolios’ behavior. They can send requests for aggregation data for a symbol expressed by a formula.
Example: =AAPL+2*GOOG+3*NFLX.
We offer a ready-to-use tool for creating a virtual portfolio and analyzing its performance on the chart. Formulas are efficient for portfolio analysis and backtesting.
Learn more
Aggregation data service highlights
- 8+ million subscriptions*
per day for real-time data backed by historical data snapshot
- 4+ million stable subscriptions*
for real-time data per day
- 9+ million request-response calls
via RMI or REST calls per minute
- Less than 40ms processing time
in 99% of cases
* – subscription is a request to receive historical and real-time data
Current data service load
- Over 30,000 subscriptions per second in peaks
- Over 1.5 million incoming raw messages per second in peaks
- Average 390,000 incoming raw messages per second
- Over 500,000 outgoing candles per second in peaks
- Average 260,000 outgoing candles per second


