dxFeed Volumetrica Trading
VolSys
VolSys® is a professional trading platform whose main goal is the analysis of volume profiles, time and sales, order flow, and footprint.
Features
Volume Profile
Volume profile is one of the most powerful volume indicators because it highlights the most interesting zones of price and how they were executed, thanks to the delta profile. VolSys® provides an innovative approach to visualization using automatic tick grouping of delta profiles to promptly identify absorption and pressure zones. Additionally, it offers the capability to construct a pseudo profile for analyzing extended periods, spanning ten years or more.
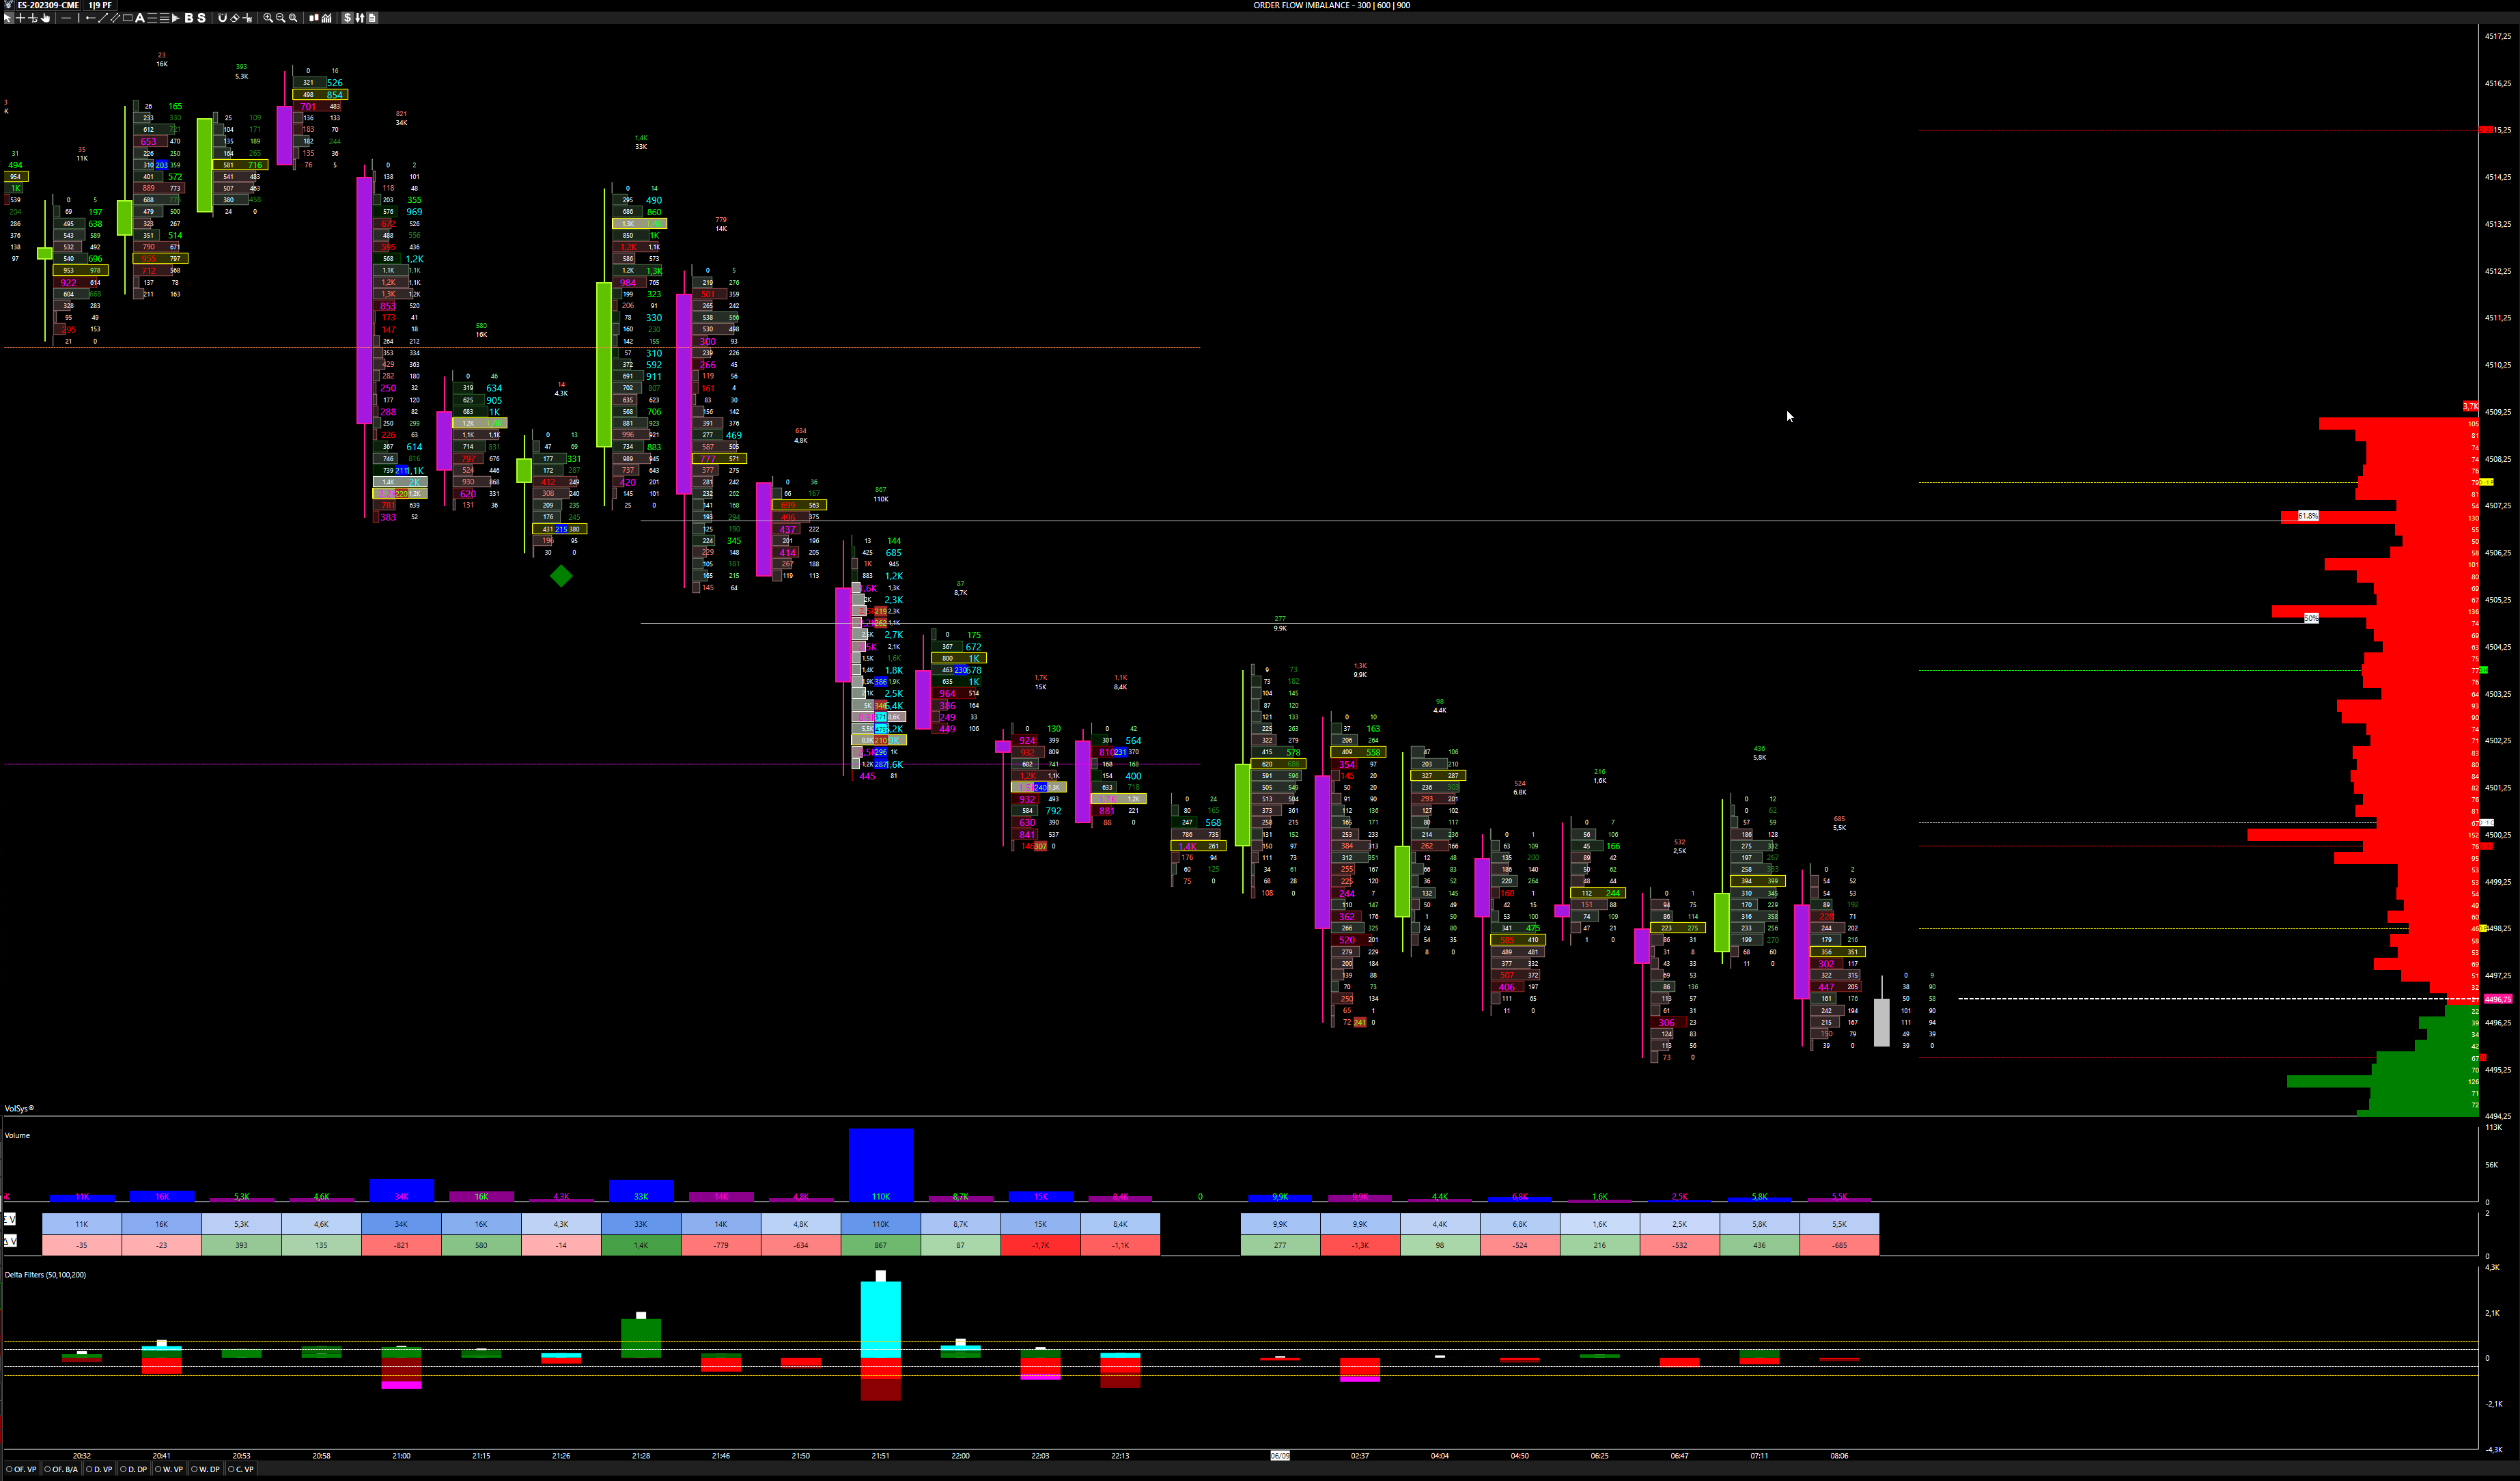
Order flow analyzer
Order flow analyzer is another very important indicator in volume analysis because it combines price, volume, and order flow (Time&Sales) in a single bar. It helps traders identify potential support and resistance zones, buyer/seller acceleration, absorption, exhaustion, trapped trades, and many other market actions.
This indicator is fully customizable, as you can display total volume, delta volume, or bid/ask split volume with the possibility to color background and text based on several conditions such as delta or imbalance, with automatic or user-defined filters.
Advanced Time&Sales
Our version of tape (Advanced T&S) combines individual prints back together (the way it used to be before 2009), so you can easily see the actual market orders to their full extent, and it allows you to filter the size of their orders so you can easily sense what the larger/smaller traders are doing at the moment.
It is also possible to enable relative sound alarms with the possibility to show some other essential information, including Iceberg Orders and Quantity Orders entered associated with the trades executed.
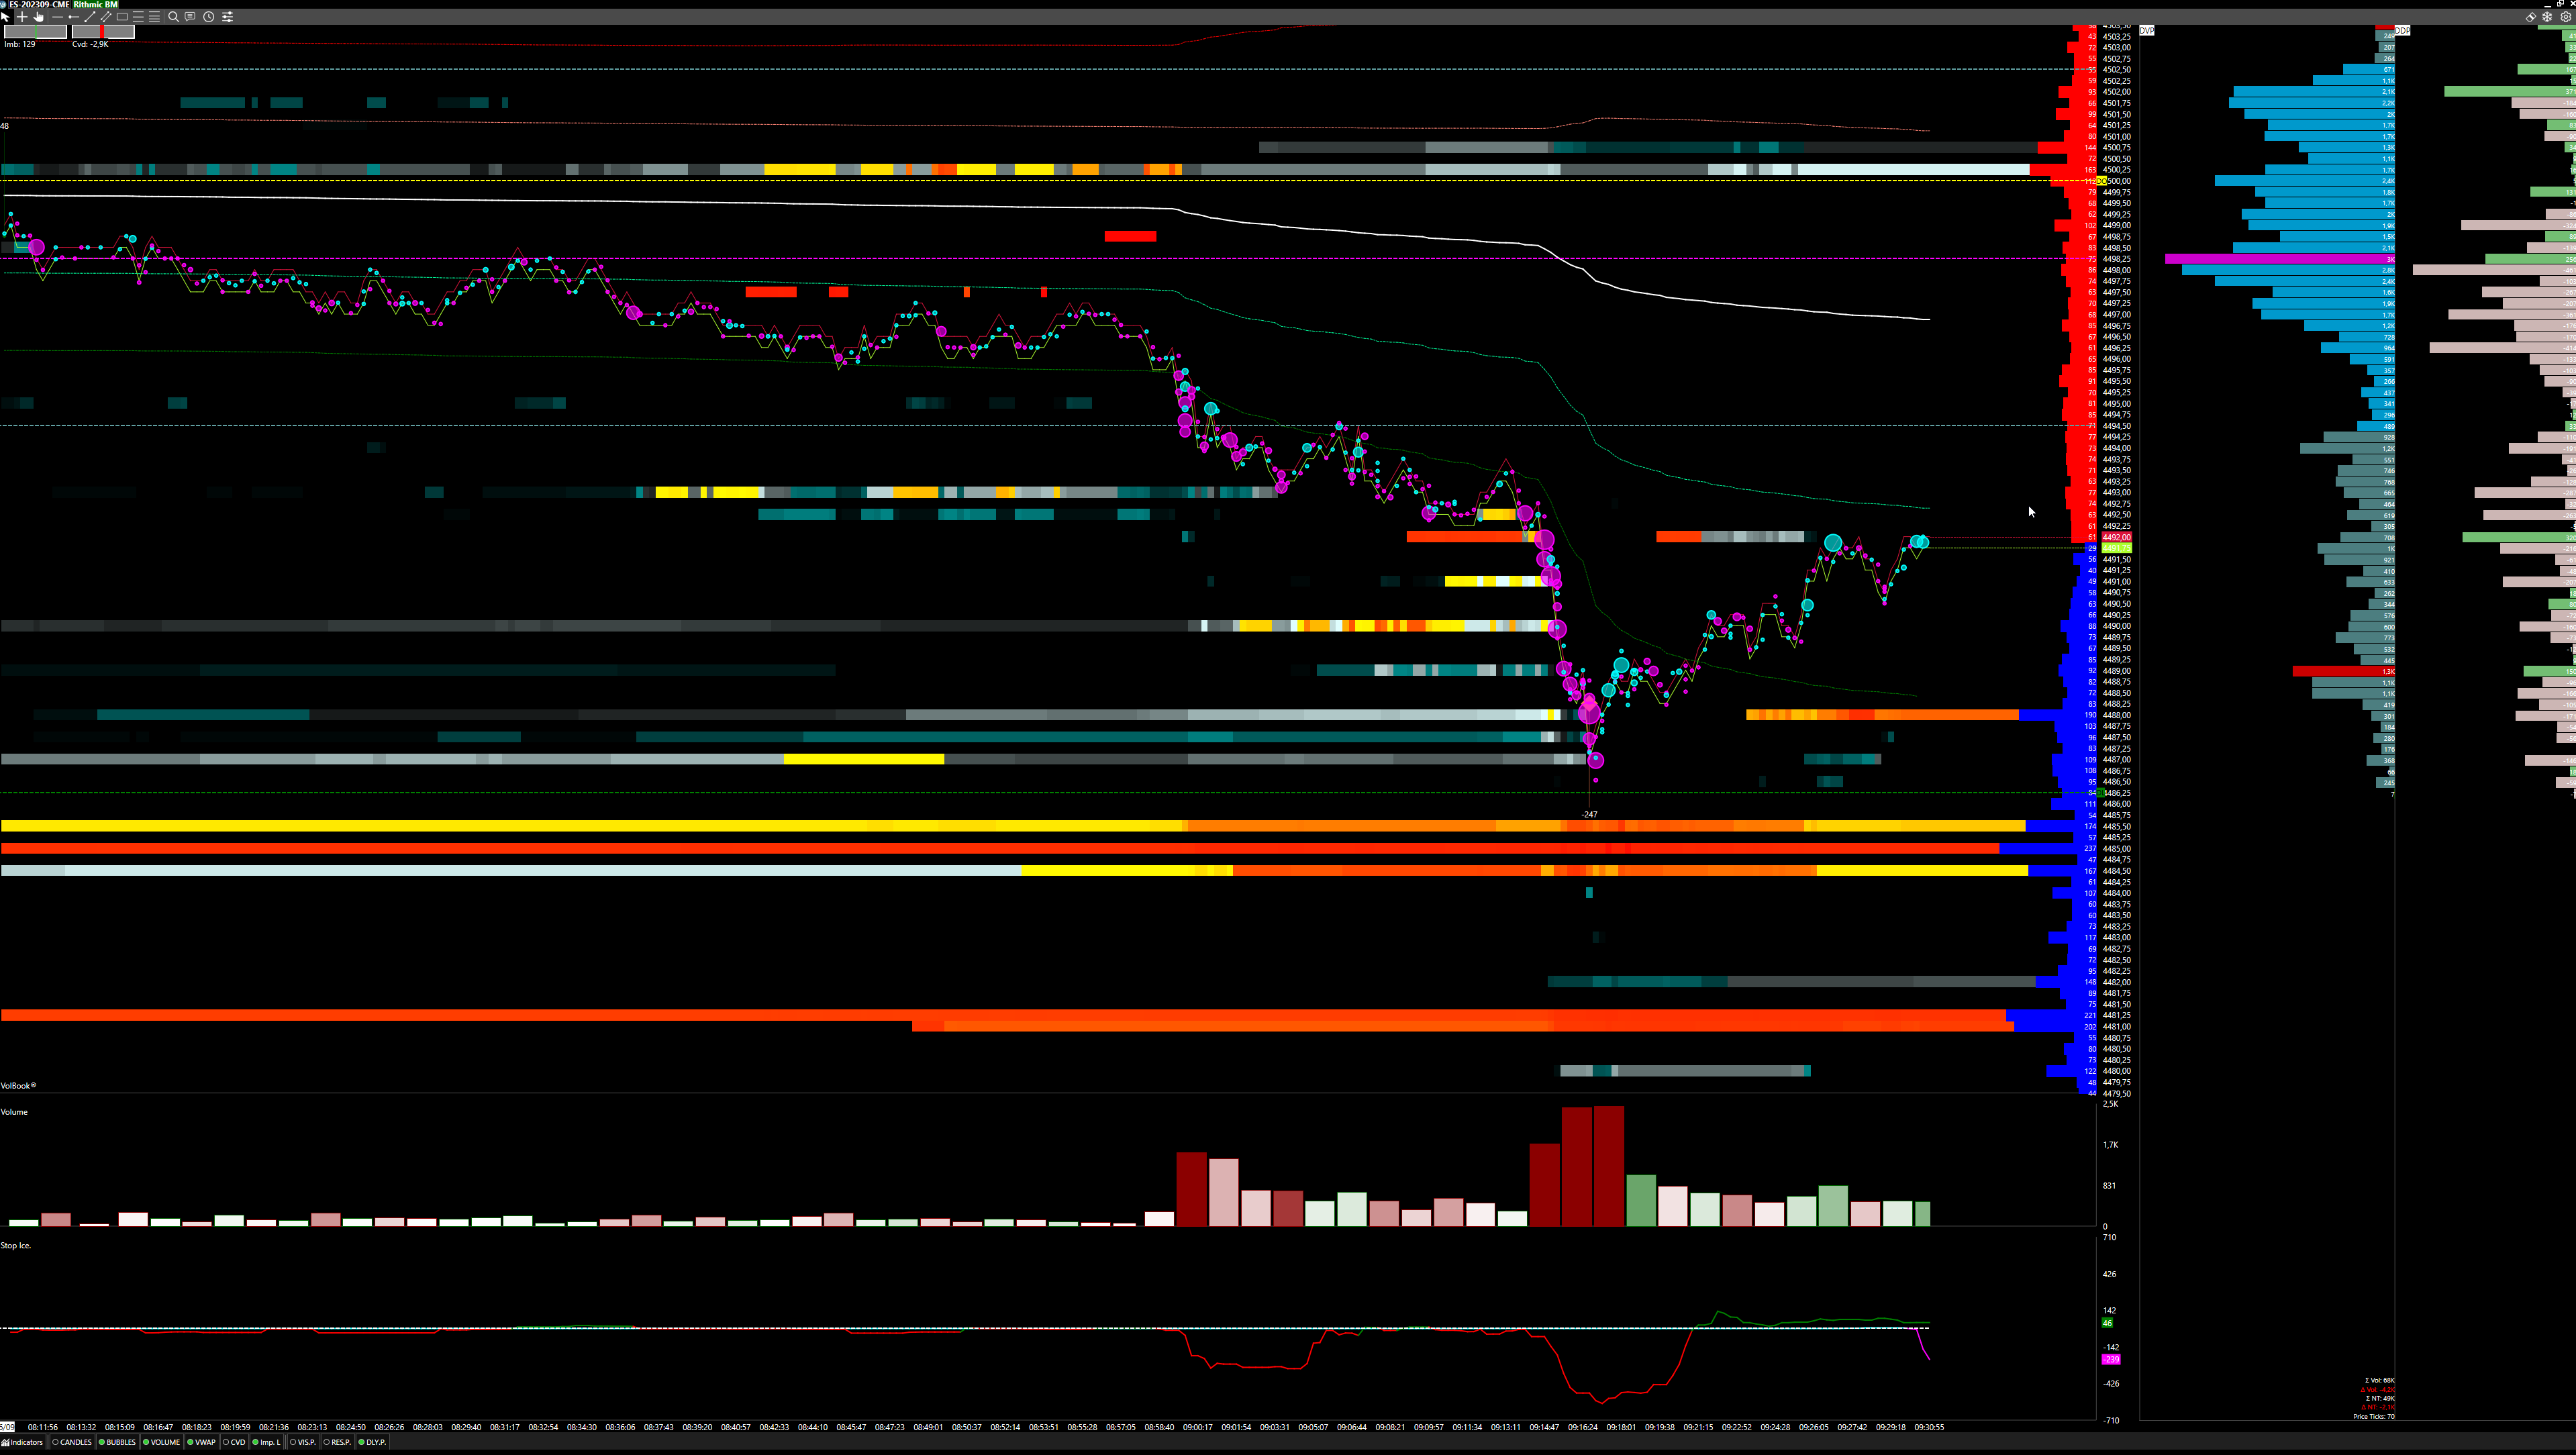
VolBook
VolBook® is a professional volume trading platform which offers an innovative way for the display and the analysis of the market depth without neglecting the study of the level 1.
Features
Book liquidity chart
The core of our platform lies in market depth analysis presented as a heatmap. Each price level changes color based on the quantity of limit orders at that level, enabling traders to spot support and resistance areas and anticipate market movements as prices fluctuate while seeking liquidity for order execution.
This depth analysis is impractical with the traditional vertical order book, as it fails to capture post-trade liquidity changes. VolBook® supports full-depth analysis, exceeding 1000 levels, which is crucial for this type of examination.
Iceberg orders
Utilizing market-by-order (MBO) data, VolBook® can identify executed iceberg and stop orders, making key moments stand out. For the Italian stock market, Volumetrica Trading developed an algorithm within VolRT to detect iceberg orders.