What do European football teams, Big Macs, and the lengths of women’s skirts all have in common? The answer is that each of the unlikely members of the above group has an Index associated with it.
The STOXX Europe Football Index tracks the changing values of football teams listed on stock exchanges in Europe, Eastern Europe, and Turkey. The Economist’s Big Mac Index tracks the relative price of the MacDonald’s flagship burger worldwide. Finally, though theoretical, the Hemline Index posits that women’s skirts get shorter during times of economic prosperity, and longer during times of hardship.
The point? Indices are a really useful way of comparing the performance of groupings of similar items over time. They’re enormously important when it comes to identifying and understanding trends, proposing and implementing policies, and are also investable through a variety of derivatives contracts and investment vehicles built on top of them.
At dxFeed, we’ve been in the business of market data for many years, and are always looking for interesting ways to slice that data in order to add value to both trading venues and market participants. Our recent entry into the world of financial indices began with a number of innovative benchmarks for Small Exchange, Miami Exchange, and Susquehanna International. Not content with resting on our laurels, we’ve been hard at it, trying to see what else we can bring to market that can help traders and investors ply their respective trades.
One of our newest efforts we’re affectionately calling the Bixie (BXY), a Bitcoin index that tracks the number one cryptocurrency’s performance relative to a basket of other cryptocurrencies. The Bixie was envisioned as a crypto twin of the Dixie (DXY), the premier US dollar index that has faithfully tracked the value of the greenback against a basket of its peers since 1973. The idea behind the Bixie is that comparing like with like (rather than against fiat currencies) will be valuable for investors, especially as the crypto market continues to mature, and should provide a useful gauge of bitcoin’s predominance as an investment in the crypto market over time. It tracks, in percentage terms, the value of a long position in Bitcoin when compared to a basket of other cryptocurrencies weighted by real trading volumes.
Like its older sibling, the Bixie is calculated using a geometric mean of the value of a basket of bitcoin’s crypto peers. Geometric means are particularly useful in the context of financial markets as the items being tracked are serially correlated (i.e., an asset’s current value is correlated with its value at different points in time), allowing for more accurate indications of true returns by taking the effect of compounding into account.
Where the Bixie differs from the Dixie is in the size of its basket. The US dollar index basket contains six global currencies (euro, yen, sterling, Canadian dollar, Swedish krona and Swiss franc), whereas the Bixie basket currently contains 100 cryptocurrencies.
Another notable difference between the two indices is that, despite being known as a trade-weighted index, the Dixie basket is arbitrarily weighted (EUR 57.6%, JPY 13.6%, GBP 11.9% CAD 9.1%, SEK 4.2%, CHF 3.6%). While this weighting may have previously represented the most traded major currencies, the global FX market has significantly departed from the above weightings over time. According to the 2022 BIS Triennial Central Bank Survey, the six most traded currencies after the US dollar are as follows. EUR 30.5%, JPY 16.7%, GBP 12.9%, CNY 7%, AUD 6.4%, CAD 6.2%.
Also, as you can see above, the DXY is overwhelmingly influenced by the euro, with the single currency accounting for almost 60% of the index’s weighting. According to many commentators, this just makes the DXY a proxy for the EURUSD trade. By comparison, ETH, the second largest cryptocurrency by market cap, currently only accounts for around 25% of the BXY.
In our construction of the Bixie, it was very important to us that the index be as up-to-date and relevant as possible. This is particularly important in an asset class such as crypto, which is so new and moving at such breakneck speeds.
Bitcoin itself has only been around since 2009 and, depending on where you take your starting point, the broader crypto market is currently on its fourth market cycle. If you look at the composition of the top ten cryptocurrencies throughout each cycle, you’ll notice that only bitcoin has kept its place (and to a lesser extent ether since 2017). Many of the names that were in the top ten just five years ago have since been relegated much further down the list. For this reason, it was crucial to us that the weighting methodology of the BXY would reflect the dynamic nature of crypto markets, so as to ensure that the Bixie will be as relevant to investors in the future as it is today.
Many indices use market cap weighting, the S&P family of cryptocurrency indices uses this weighting methodology, as does the Bitcoin Dominance (BTC.D) metric calculated by TradingView. While capitalization-weighted indices are the norm in regulated markets (the S&P 500 is perhaps the most famous capitalization-weighted index), market cap alone can be rather problematic in crypto. This is due to the open-source nature of the space, where any party is able to create a token with a large overall supply and a low float, which can appear to have an enormous market cap on meagre volumes. This despite the token being totally irrelevant in the broader crypto industry. We’ve seen such coins shoot up the market cap rankings throughout the various crypto cycles before promptly disappearing.
In order to prioritize the relevance and importance of the coins we include in the basket, and to mitigate the above risks (as well as to avoid the pitfall of requiring dxFeed to curate the basket) we opted for a trade weighting. The cryptocurrencies included in the Bixie basket are weighted according to their relative turnover on several of the largest crypto exchanges, taking account of their volumes when paired against fiat, stablecoins, bitcoin, and all other available “minor” crypto pairings.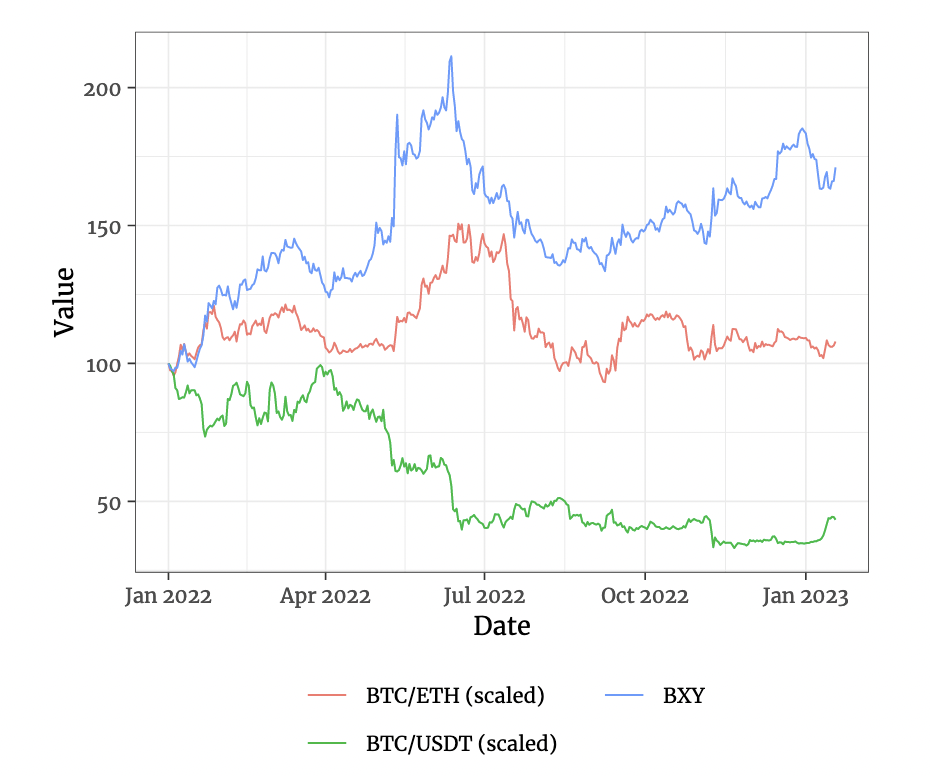 The effect of constructing the index in this way is to provide a crypto-centric view of the market that is far less influenced by the dollar value of bitcoin. As you can see from figure, the volatility of this asset class in dollar terms, where you can expect peak to trough drops of over 80%, and trough to peak rallies of over 1000%, has the effect of disguising underlying trends within the crypto market itself, particularly at the extremes.
The bitcoin dominance metric is a novel and useful way to track the periods in each market cycle where “altcoins” outperform bitcoin and vice versa. However, this measure is also overly influenced by irrelevant cryptocurrencies. Additionally, the way it is calculated dooms bitcoin’s “dominance” to carry on falling indefinitely as altcoins multiply in number, in perpetuity. Meanwhile there can only ever be one bitcoin, meaning that its share of the overall market continues to drop.
We regard the Bixie as a highly reliable, robust, and trustworthy benchmark of bitcoin performance that we believe gains a great deal of authority from dxFeed’s access to high quality data, as well as its investment grade processes, reporting, and index management capabilities.
For more information on the Bixie index, our other products, or for our custom index creation and management services, please contact one of our representatives by using the form below.
Construct your index
Check out the demo of the on-the-fly construction of an index.